Something happened this week that I keep turning over.
MIT published findings this month showing that when 41 AI models were tested across more than 11,000 real workplace tasks, the result was, in their words, like a “disenchanted intern” — hitting minimum benchmarks about 65% of the time, but never exceeding 50% success on tasks requiring genuinely superior-quality output. If you work in software, marketing, legal services, or knowledge work of any kind, that’s the snapshot.
METR — a nonprofit focused on measuring AI capabilities — published a different kind of snapshot. Their metric is the “time horizon”: the maximum length of autonomous task a frontier AI can reliably complete. In 2019, the best AI could handle roughly a two-minute task without human intervention. By the end of 2025, that had grown to roughly an hour. The doubling time across that whole period: around seven months.
METR’s January 2026 update tightened that number further. Post-2023, the best estimate for the doubling period is now 130 days — closer to four months.
My read on this:
The MIT study and the METR data aren’t in conflict. They’re measuring different things at different timescales. MIT is taking a photograph. METR is measuring the shutter speed. And the shutter speed is getting faster.
I don’t think the “disenchanted intern” framing is wrong — it describes today accurately. What I’m less sure about is the assumption, implicit in most of the coverage I’ve read this week, that “today” is a stable state. An intern who gets twice as capable every four months is not the same resource at the end of the year as they are today.
What I keep returning to is the gap between the current snapshot and the trajectory — and the opportunity that opens up in that gap. The MIT data is a photograph of now. The METR data is the shutter speed. Anyone building workflows, designing teams, or structuring how they work around AI capability today is working from a reference point that will be measurably out of date within a single planning cycle. That’s an opportunity signal at a scale and pace most planning assumptions don’t account for.
Three things I’m watching:
1. Where the doubling curve hits friction. Every exponential eventually meets a wall — physical limits, data constraints, regulatory friction. METR’s time-horizon metric is useful precisely because it measures real-world task completion, not synthetic benchmark scores. When the doubling cadence breaks, that will be the signal that the curve has met something real. I expect that to happen. I just don’t know when.
2. Whether “minimally sufficient” matters or not. MIT’s 65% minimally sufficient rate sounds modest. But most enterprise workflows run on people who are minimally sufficient most of the time. The threshold isn’t excellence — it’s “acceptable at scale, around the clock, at near-zero marginal cost.” That bar is lower than it sounds, and closer than the headline number implies.
3. The infrastructure spend as an access unlock. Alphabet, Meta, Microsoft, and Amazon are projected to spend nearly $700 billion combined on AI infrastructure in 2026 — roughly double what they spent last year. That capital isn’t just building capacity for the current snapshot. It’s funding the cost compression that makes the next several capability doublings broadly accessible. When the infrastructure matures, the cost floor drops — and the surface area for building on top of it expands with it.
The disenchanted intern framing is apt today. My expectation is that it’s a better description of 2025 than it is of 2027.
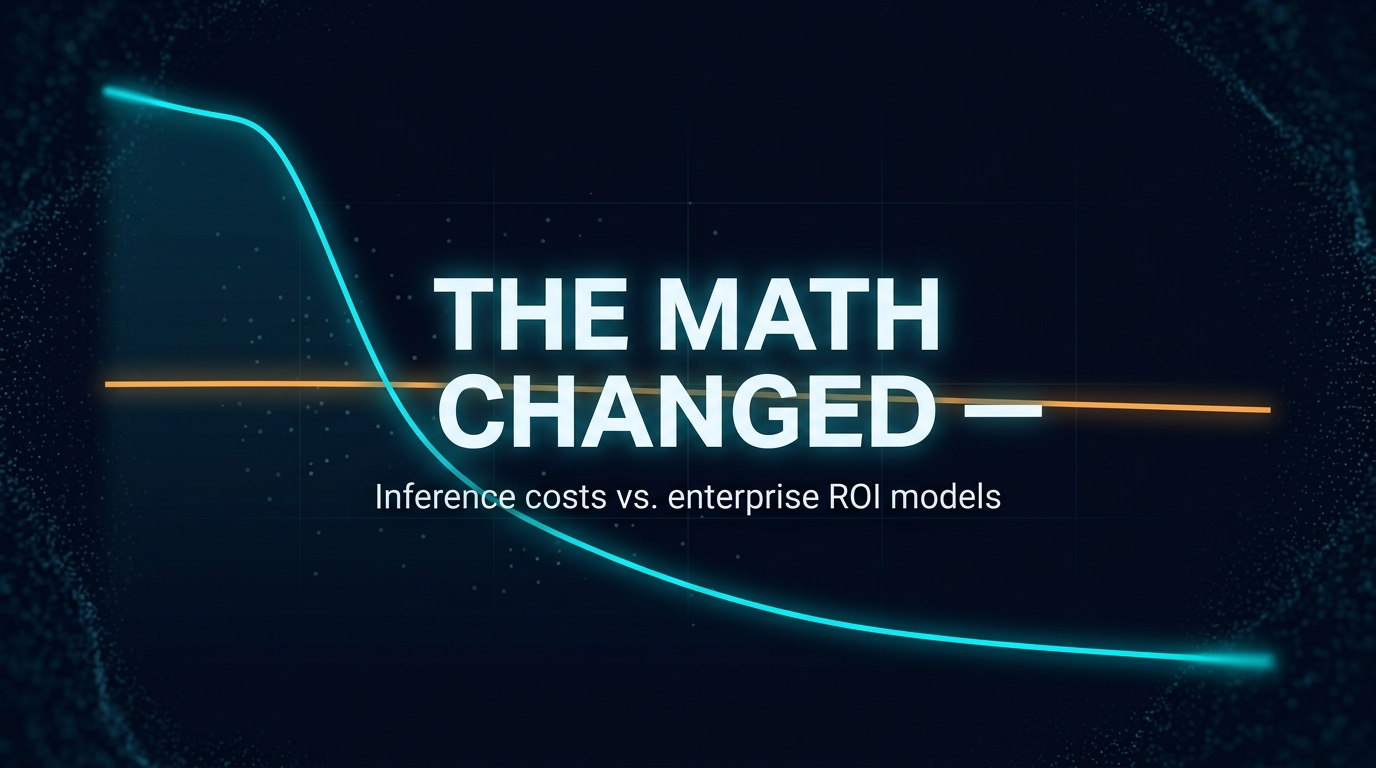
GPT-4 class inference cost $20 per million tokens at launch in early 2023. In April 2026, equivalent performance runs $0.40. Most enterprise AI business cases were built somewhere in the middle — and haven’t been updated since.
That gap is not a technology story. It is an arithmetic problem wearing a strategy hat.
What moved
Inference costs have declined faster than the bandwidth price collapse of the early internet era, faster than PC compute, and considerably faster than any enterprise finance model anticipated. Artificial Analysis tracks it live: the cheapest capable models today run under $0.50 per million tokens. A flagship model that cost $10 per million tokens eighteen months ago now costs $2–3. The price range between the cheapest and most expensive capable options has widened past a thousand-to-one.
The driver is compounding. Better training efficiency produced more capable models at lower operating cost. Competition between providers accelerated the pass-through. Specialised chips entered the stack. The result: a cost curve that looks less like traditional software pricing and more like solar panel economics — each year’s curve is below where last year’s curve said it would be.
What did not move
Enterprise AI business cases.
S&P Global found that 42% of companies abandoned most of their AI projects in 2025. Cost and unclear value were the top reasons cited. IBM put the share of AI initiatives delivering expected ROI at 25%. MIT found that 95% of AI pilots delivered zero measurable P&L impact (MIT NANDA, State of AI in Business, 2025).
These numbers are real. But the interpretation of why projects fail is often imprecise.
Projects approved in 2023 and 2024 were scoped against the pricing environment of 2023 and 2024. The cost models that informed the go/no-go decisions used token prices that no longer exist. The ROI denominators were anchored to infrastructure assumptions from a period when GPT-4 access cost $10–20 per million tokens. The business cases that were rejected on cost grounds — the ones that landed below the internal ROI hurdle by a thin margin — were rejected against a cost basis that is now a fraction of what it was.
That is not a technology failure. It is a modeling lag.
Andreas’s view
My read on this: there are two different things getting conflated in the ROI conversation. One is genuinely poor outcomes — wrong use case, shallow integration, insufficient change management. That is real and deserves scrutiny. The other is a systematic understatement of AI’s economic potential because the cost assumptions in the business case never got refreshed. Those two phenomena look identical in the data.
I don’t think the 42% abandonment rate or the 25% ROI hit rate tells us much about what AI can do at today’s prices. It tells us how enterprises perform against business cases built on 2023 assumptions. The projects that got killed for cost reasons in Q4 2024 would look different rerun against Q2 2026 pricing.
My expectation is that the organisations getting ahead of this are running a specific exercise that most are not: taking the cost assumptions out of every AI initiative that was rejected or stalled in 2023–2025, replacing them with current market rates, and seeing which cases cross the ROI threshold now. Not all of them will. But some will — and the decision to revisit them is a spreadsheet exercise, not a technology project.
Three things I’m watching:
Whether finance teams are treating inference cost as a stable input or a variable. Most enterprise budget models treat infrastructure cost as a constant. Inference cost is not a constant — it has been declining faster than almost any other enterprise input cost in the last three years.
The spread between unit cost and total spend. Per-token costs have collapsed, but total enterprise AI spend is forecast to jump 65% in 2026 — from roughly $7M average to over $11M (IDC). Volume is expanding faster than unit costs are falling. The budget impact of AI is still growing, even as the underlying unit economics are dramatically more favourable than they were.
How capital allocation committees handle the remodel request. The institutional question: if a CFO approved a 2023 AI business case that underperformed, how does the organisation handle finance coming back and saying “the cost structure changed — the case should have worked, we just used the wrong numbers”? That conversation is coming.
What this reveals
The collapse in inference cost is well-understood in developer circles. Engineers who run inference workloads reset their unit economics continuously — it is operational reality. The delay is in the enterprise business case layer, where cost assumptions travel up through approval chains, get embedded in multi-year plans, and calcify.
The cost curve does not care about the approval cycle. It moved while the slide decks were in review.
This is not an argument that all AI investments look better at current pricing — some of those failed pilots would have failed regardless, and the organisational conditions for AI success (clear scope, embedded workflows, meaningful accountability) have not gotten easier. But a non-trivial fraction of the projects that stalled on cost now live in territory where the math is different. Identifying them is a shorter path to AI ROI than starting new initiatives from scratch.
Every knowledge worker is a manager now. Agentic AI has turned individual contributors into managers of AI agents, and first-line managers into leaders of managers of agents. The job descriptions have not caught up yet. The operating models have not caught up yet. The reskilling plans have not caught up yet. All of that is lagging the capability frontier by twelve to eighteen months — and the organizations that close that gap first will operate at a structurally different throughput than the ones still writing job descriptions for the jobs that existed in 2023.
The shift: agentic AI crosses the line from tool to colleague
For the first year and a half after ChatGPT, the thing called “AI” in most organizations was a better search box. A more patient editor. A faster rough-draft generator. Useful, but still a single-interaction tool. You asked, it answered, you moved on. The job of the knowledge worker did not fundamentally change — they just had a slightly sharper pencil.
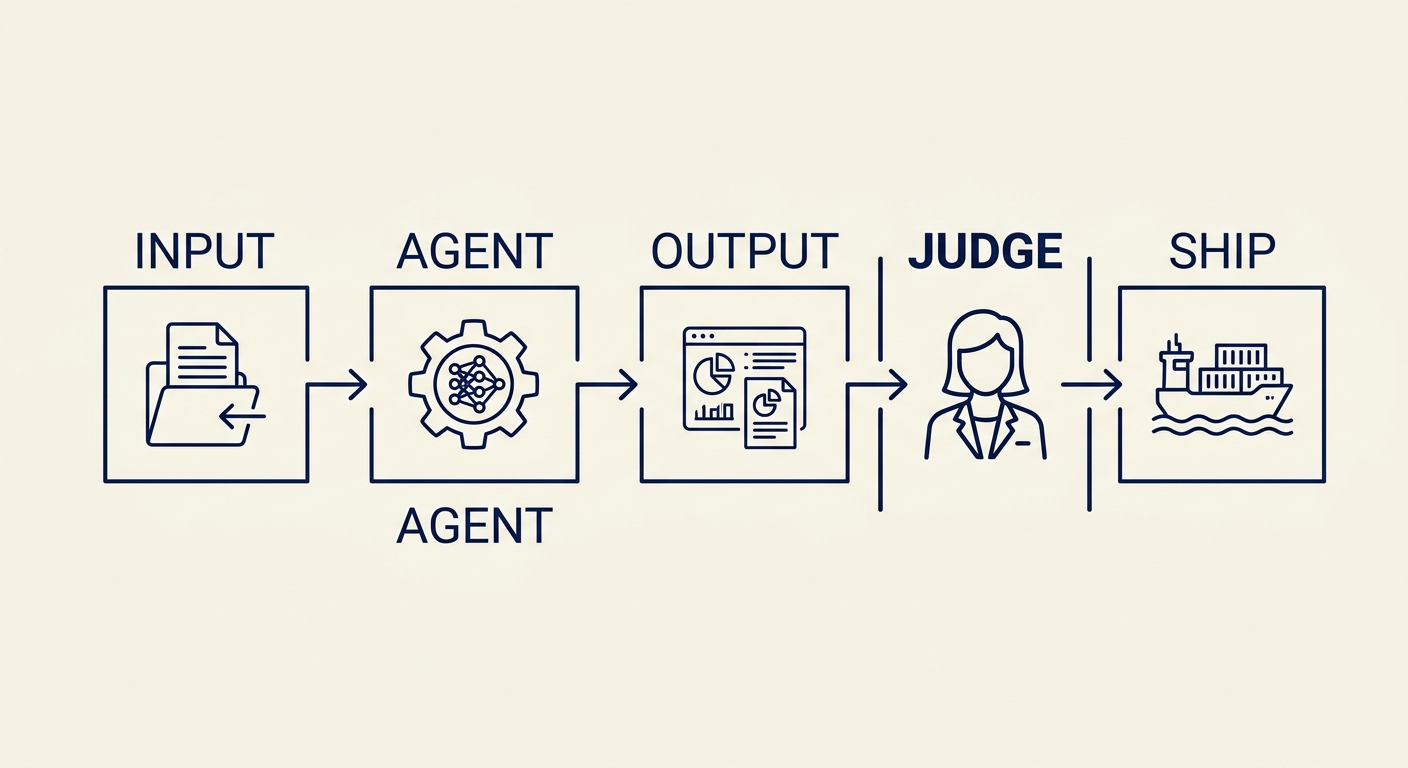
What changed in the eighteen months leading into 2026 is the arrival of agentic models. The word “agent” in that context is not marketing. An agent is a system that can do a sequence of things, hold state across those steps, make decisions about what to do next, use tools, and come back with a completed multi-step task. That is a categorically different interaction than “ask question, get answer.” It is closer to “give a junior colleague an outcome to produce and trust them to produce it.” The commercial consequence of that shift is the subject of this post.
Input → agent → output → judge → ship. The human stays at the judgment node.
The role change: ICs become managers of agents
The individual contributor job has silently changed. Writing short summaries of long content — once a junior-to-mid task — is now an agent task. The human role is to specify the outcome, check the output, and decide what to do with it. Meeting preparation — the pre-meeting brief of background, context, attendees, prior touchpoints — is now an agent task. The human role is to feed the context, review the brief, and adjust the framing. Drafting a first pass of almost any structured document — a proposal, a plan, an analysis — is now an agent task. The human role is the editor, not the author of the first draft.
The common thread is that the IC’s job has shifted from doing to specifying outcomes and judging output. Those are management skills. Not in the metaphorical sense — in the literal sense. Framing a task clearly enough that someone (or something) else can execute it. Evaluating whether the execution meets the specification. Deciding when to iterate and when to ship. These are exactly the skills that used to distinguish a first-line manager from a senior IC, and they have become baseline requirements for an IC working with agents.
The new role for the IC: editor of agent output.
The org change: first-line managers become leaders of managers of agents
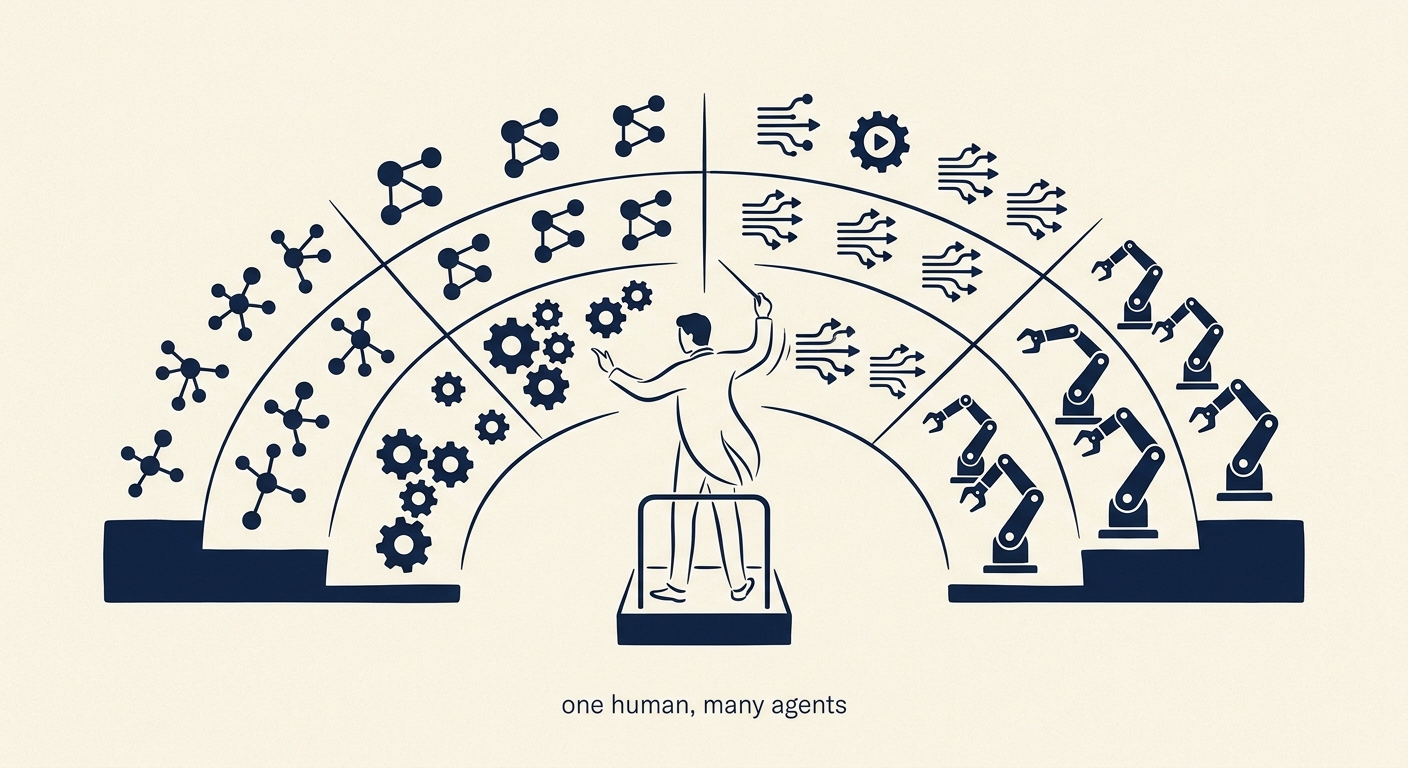
If every IC is now a manager of agents, then every first-line manager is now a leader of managers of agents. Their job is no longer to supervise execution — the agent is doing the execution. Their job is to coach the humans on their team in how to specify outcomes, how to judge output, how to know when an agent is producing garbage, and how to scale their orchestration over time. That is a completely different job than the first-line management job of three years ago, and it requires a different skill set.
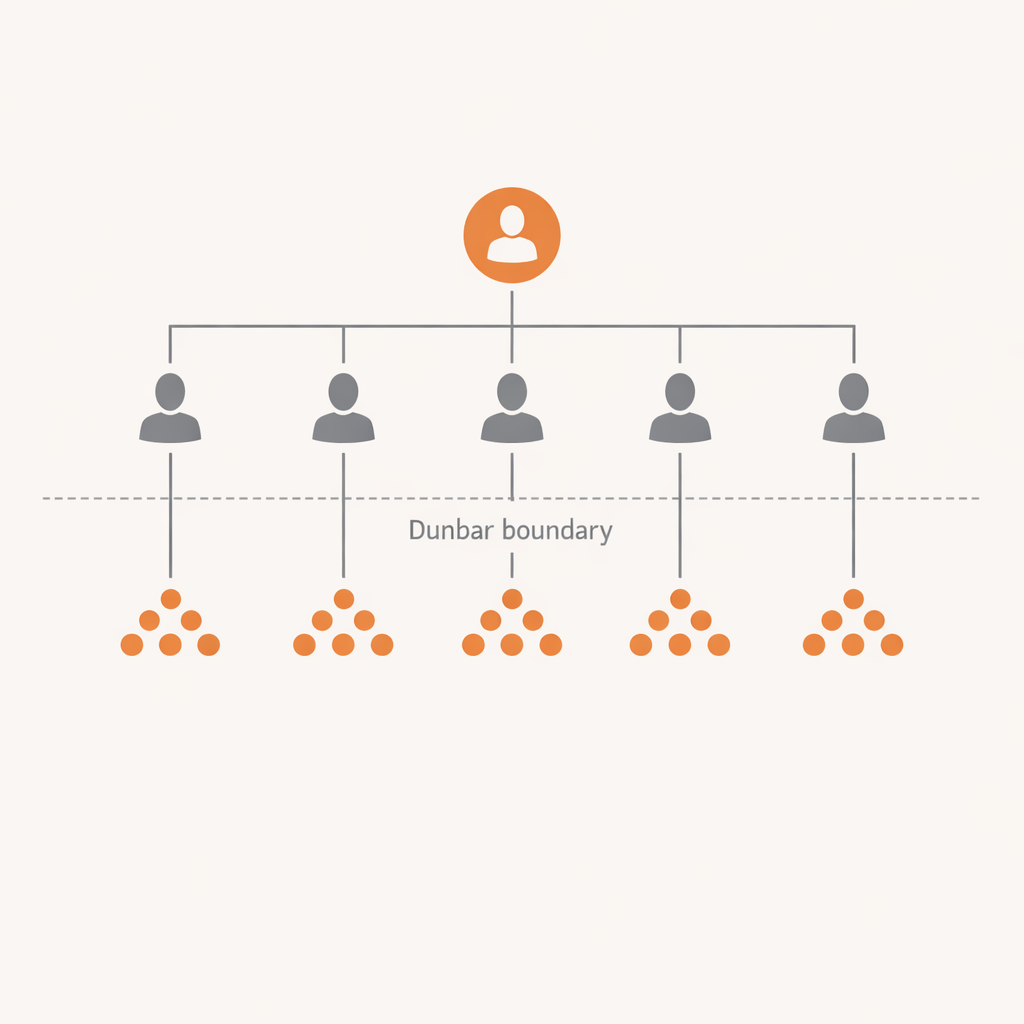
Two structural consequences follow. First, the middle management layer compresses because a first-line manager leading managers-of-agents can reach further than one managing direct executors — the coordination overhead per report drops when the reports are themselves operating on a multiplier. Second, the definition of “span of control” stretches, but not infinitely: the Dunbar layers still govern the number of humans a manager can hold relationships with, even if each of those humans is now operating agents underneath them. The org chart can get flatter. It cannot get unbounded.
One human, many agents — the conductor metaphor for first-line management at scale.
The strategic consequence: orchestration is now a baseline skill, not an advanced one
The skill that used to distinguish senior managers from junior ones — the ability to frame work so someone else can execute it and judge whether their execution is good — is now a baseline IC capability. Orchestration is the new baseline. Writing is the new baseline. Judgment about output quality is the new baseline. The organizations that will operate at structurally higher throughput over the next five years are the ones that reskill their IC population around these baseline orchestration skills, rather than hiring more specialists who each do one thing well.
Talent leverage, not headcount, becomes the scoreboard. A commercial organization that operates at 300 humans with strong orchestration capability can outproduce a commercial organization that operates at 600 humans with legacy IC job descriptions. The difference is not about working harder. It is about operating model. The 300-human organization has fewer Dunbar breakpoints, shorter decision loops, less cross-functional friction, and a higher per-seat agent-multiplier. All of that is the consequence of a single structural decision made at the job-description layer.
So what boards should do
Three actions sit on the CEO agenda over the next two quarters. First, rewrite the IC job descriptions for every knowledge-worker role in the organization so that orchestration and output judgment are explicit baseline capabilities, not bonus ones. Second, rewrite the first-line management job description so that coaching for orchestration is the core of the role, not supervision of execution. Third, audit the reskilling plan against the assumption that every knowledge worker in the organization is now a manager and needs to be trained as one — because the capability frontier has already shipped and the only question is whether the organization catches up in quarters or in years.
Boards that do not require a reskilling plan at this scope are budgeting against an operating model that does not exist anymore. The plan does not need to be perfect. It needs to exist. The gap between organizations that have this plan and organizations that do not is the structural competitive advantage of the next five years, and it is already being measured — in throughput, in decision velocity, in the quiet retention of the top performers who can see the gap coming.
OpenAI announced the discontinuation of the Sora web and app experiences on April 26, with the Sora API following on September 24. The first deprecation triggers in two weeks. Enterprises that built workflows on Sora since launch are not facing a model upgrade — they are facing a workflow rebuild on a four-month timeline. This is the first prominent enterprise-facing AI deprecation event of the cycle, and the precedent it sets matters more than the specific product involved.
Model deprecation is no longer a developer-tier concern. It is an enterprise governance question that deserves a place on the risk committee agenda. The real shift is happening here: AI dependency without continuity is becoming a board-level risk in 2026.
The shift: dependency without continuity guarantees
The pattern of the past two years has been to build agent workflows on whichever foundation model was demonstrably best at the time, with little contractual commitment from the model provider about how long that model would remain available. Provider terms have improved — Azure OpenAI’s twelve-plus-six-month commitment for generally available models is the strongest standard in market — but most enterprises have not negotiated equivalent terms with their chosen providers. They built on capability, not on continuity.
When the provider sunsets the model, the enterprise’s options are bad. Migrate to a successor model that may behave differently in subtle ways — requiring re-validation of every governed use case. Renegotiate at the eleventh hour for extended access at unfavorable terms. Or absorb the operational disruption of the workflow simply not working until rebuilt.
The Sora event is small in dollar terms but large in precedent. The next deprecation will involve a more enterprise-critical model, and the enterprises that did not see this one coming are not going to see that one coming either.
Built on capability. Not on continuity.
The role change is the addition of an AI continuity discipline
Inside enterprises that take this seriously, a discipline is emerging that did not exist in 2024 — AI continuity management. The work overlaps with vendor management, with disaster recovery, with model risk management, and with regulatory compliance, but it is structurally distinct from all of them. The discipline involves maintaining an inventory of model dependencies by workflow, negotiating continuity commitments at procurement, running successor-model regression tests on a regular cadence, and ensuring that the documentation chain meets the rebuild-readiness standard.
Most enterprises have not staffed this discipline. The accountabilities are scattered across teams that do not coordinate. The procurement team negotiated the model contract a year ago without a continuity clause. The deployment team is building production dependencies on the model without thinking about migration cost. The risk team has not flagged model deprecation as a category. When the deprecation announcement lands, the company finds out it has no plan.
The fix is straightforward in concept and slow in practice. Add continuity commitments to the procurement template. Build a model-dependency inventory. Designate an owner for AI continuity at the executive level. Run quarterly successor-model tests. None of this is hard. It is just unglamorous work that does not get done unless someone owns it.
The strategic consequence is renewed buy-versus-build math
Continuity risk changes the calculus of where to deploy AI capability. For workflows where the cost of unplanned migration is high — regulated workflows, mission-critical operations, customer-facing experiences with high switching costs — the case for either fine-tuning a frontier model into a controlled deployment, partnering with a vendor offering enterprise-grade continuity commitments, or building on open-weight models the enterprise can host indefinitely is stronger than it was in 2024. The case for relying on whichever model is best on a benchmark this quarter is weaker.
The math is not simple. Open-weight models lag the frontier, sometimes meaningfully. Self-hosting carries operational cost that the proprietary providers absorb. The vendor lock-in to a single proprietary provider, even with the best continuity terms, is a different kind of risk than open-weight self-hosting carries. Each enterprise has to make this trade-off based on the workflow’s tolerance for capability lag versus its tolerance for continuity disruption.
What is no longer defensible in 2026 is treating model continuity as someone else’s problem. The Sora sunset is small. The next one will not be.
So what boards should do this quarter
Add model deprecation to the risk committee agenda. The first deprecation event lands in two weeks. The board should at minimum understand which workflows are exposed and what the migration plans are.
Demand a model-dependency inventory. Which workflows depend on which models from which providers, with which contractual continuity commitments. If this inventory does not exist, building it is the priority.
Reconsider the buy-versus-build posture for mission-critical AI workflows. The 2024 default — use whichever proprietary model is best — was rational at the time. In 2026, with the deprecation precedent now visible, that default deserves an explicit reconsideration. Continuity is becoming a form of resilience. The boards that price it in this quarter will not be the ones rebuilding workflows under deadline.
Team sizes are not design choices. They are cognitive limits. The recurring numbers that show up in military units, religious communities, hunter-gatherer bands, and commercial organizations are not management philosophy. They are a property of the animal doing the work, and any organizational structure that pretends otherwise pays a measurable tax in friction, communication overhead, quiet attrition, and decisions that arrive three weeks late.
Two. Four to six. Eight to twelve. Twenty to twenty-five. Fifty. One hundred and fifty. The specific numbers recur across centuries and industries. In the Roman legion and the US Marines. In religious communities and hunter-gatherer bands. In tech companies, sales organizations, and the advice experienced managers give each other about when to split a growing team. It is not a coincidence. It is cognitive architecture. The constraint is no longer technology. The constraint has always been the brain doing the coordinating.
Dunbar’s layers
The research most commercial leaders eventually bump into is Robin Dunbar’s. Dunbar is a British anthropologist who, in the early 1990s, proposed that the size of a primate’s social group is constrained by the size of its neocortex. Extrapolating from primate data, he estimated the human number at around 150 — the number of people with whom any one of us can maintain a stable, recognisable, mutually-active relationship. He published it in the Journal of Human Evolution in 1992, and the number has been running through management literature ever since.
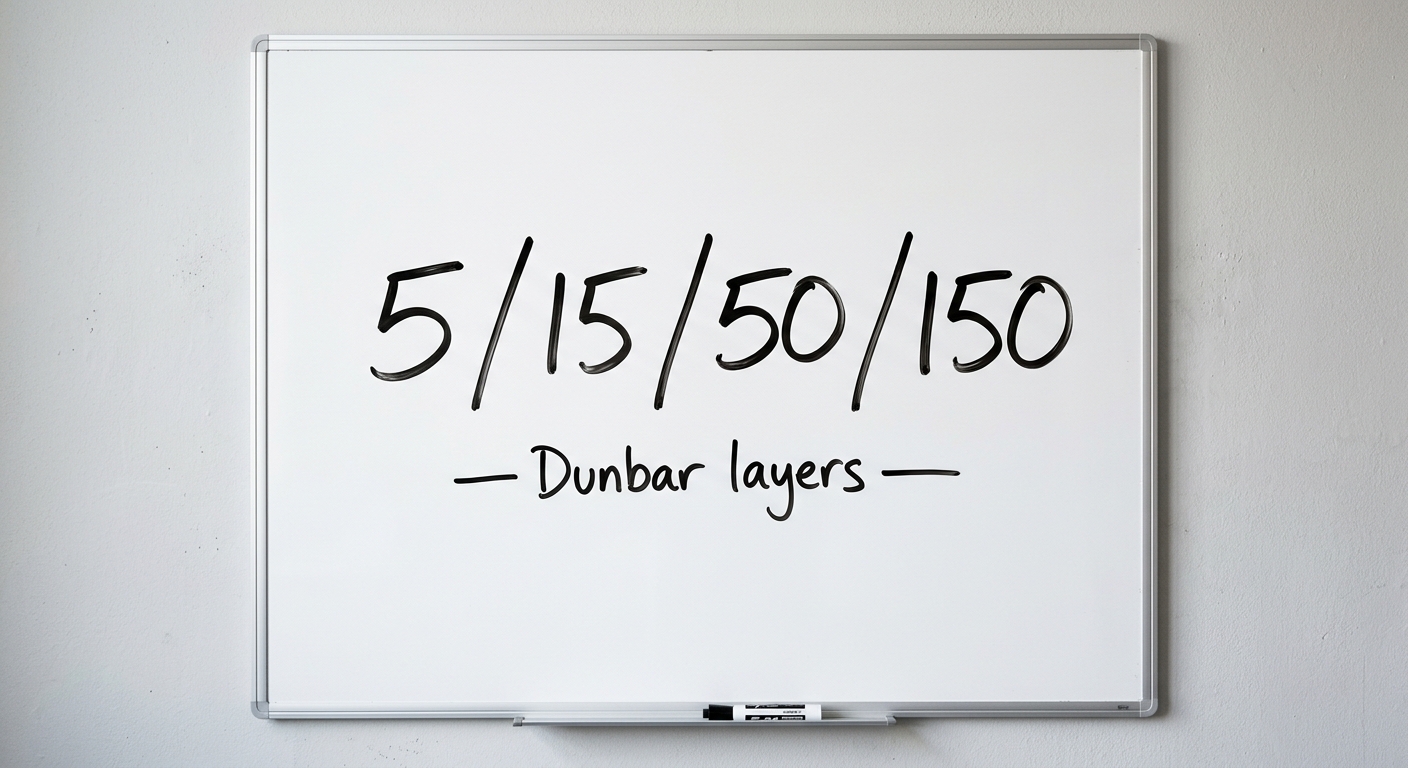
The part that gets talked about less, but matters more, is that Dunbar’s 150 is not a single flat layer. It is the outer ring of a nested set, each layer roughly three times larger than the one inside it:
~5 — your closest support group. The people you would call in a real emergency.
~15 — your sympathy group. People whose loss would significantly affect you.
~50 — your band or clan. People you know well enough to share deep context with.
~150 — your active community. Stable, recognisable, mutually reciprocal relationships.
~500 — acquaintances.
~1500 — faces you can still recognise.
These layers show up in the research almost regardless of whether the subject is a tribal society, an office workforce, or a social-network friend graph. And they map astonishingly well onto the team sizes that commercial organizations stumble toward by trial and error — not because anyone read Dunbar, but because the alternatives don’t work.
A central figure surrounded by expanding tiers — 5, 15, 50, 150.
The military got there first
Armies have been experimenting with how to organize humans under extreme stress for two thousand years, and they arrived at exactly these numbers through pure selection pressure. Smaller was too fragile. Larger fell apart under fire. The numbers that survived are the numbers that work.
A Roman legion’s smallest unit was the contubernium — eight soldiers who shared a tent, a mule, a mess, and most of their waking life. Eight. Right at the boundary between the 5-person inner layer and the 15-person sympathy group. The Romans knew nothing about neocortex ratios. They noticed that a group of eight held together in a way that a group of four or a group of sixteen did not.
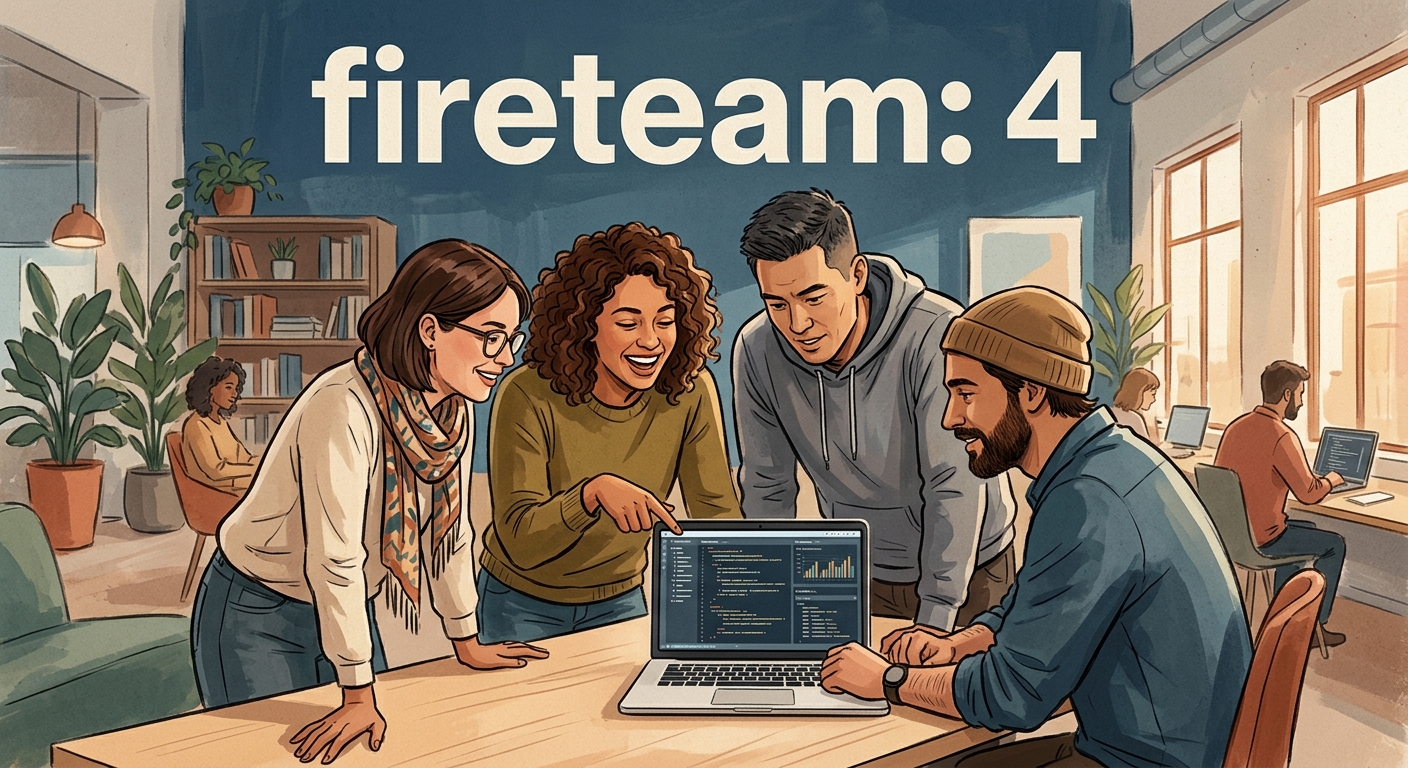
The modern US Marine Corps fireteam is four. The squad is roughly 13. The platoon is 30 to 40. The company is 100 to 150. The same ratios, twenty-one centuries later. The cognitive limits haven’t moved, because the brain they are about hasn’t.
The tech industry rediscovered the same numbers
The technology industry discovered the same structure and gave it different names.
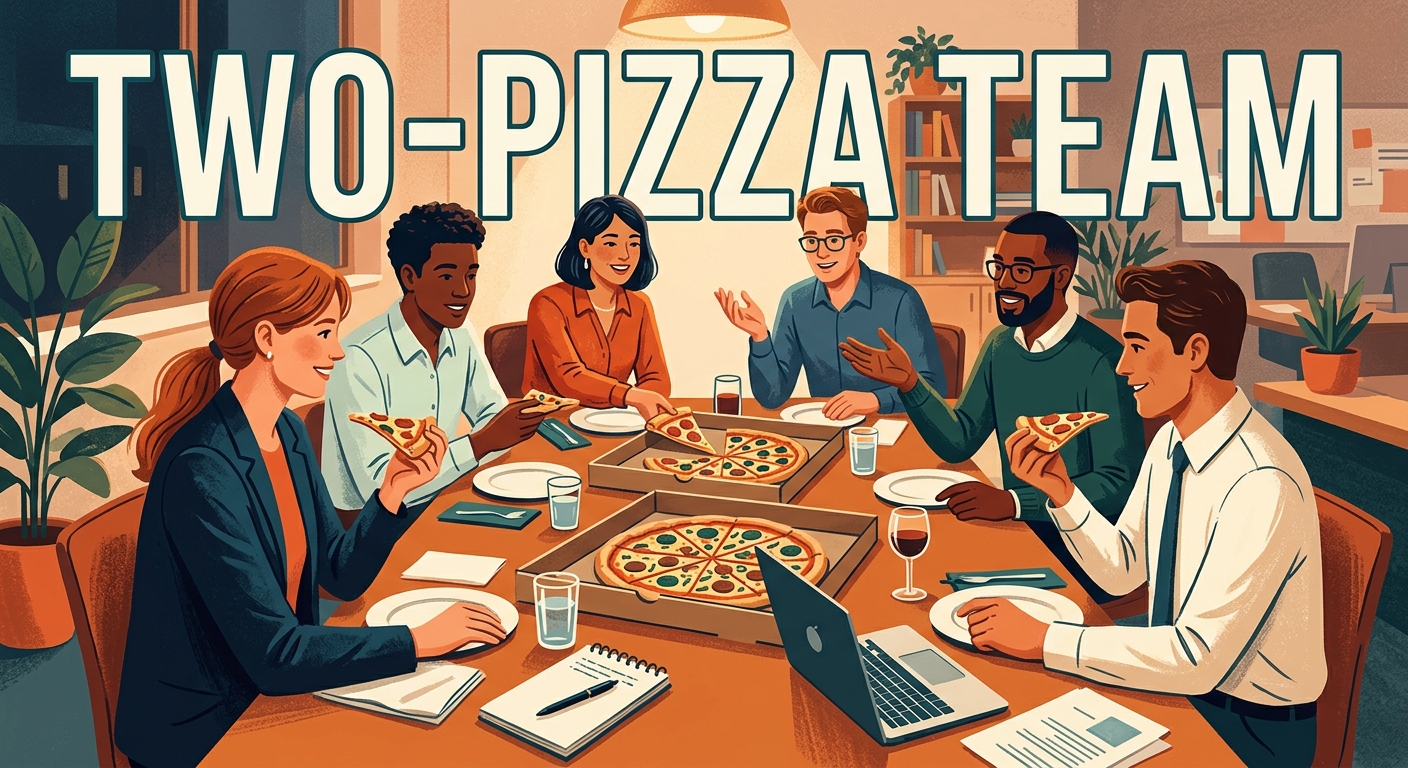
Jeff Bezos’s two-pizza rule — a team should be small enough to be fed by two pizzas — is a practical restatement of the 5-to-8 cognitive sub-layer. Amazon did not get there via anthropology. They got there by watching their own product teams stall every time they grew past the point where the whole group could fit around one table.
Scrum teams are officially 7 ± 2 — the current Scrum Guide recommends 3 to 9 members — which echoes George Miller’s 1956 paper on the working-memory limit of around seven chunks. Miller was not writing about teams. The cognitive limit he found on how many things we can juggle at once maps cleanly onto how many people we can coordinate without losing track of where everyone is.
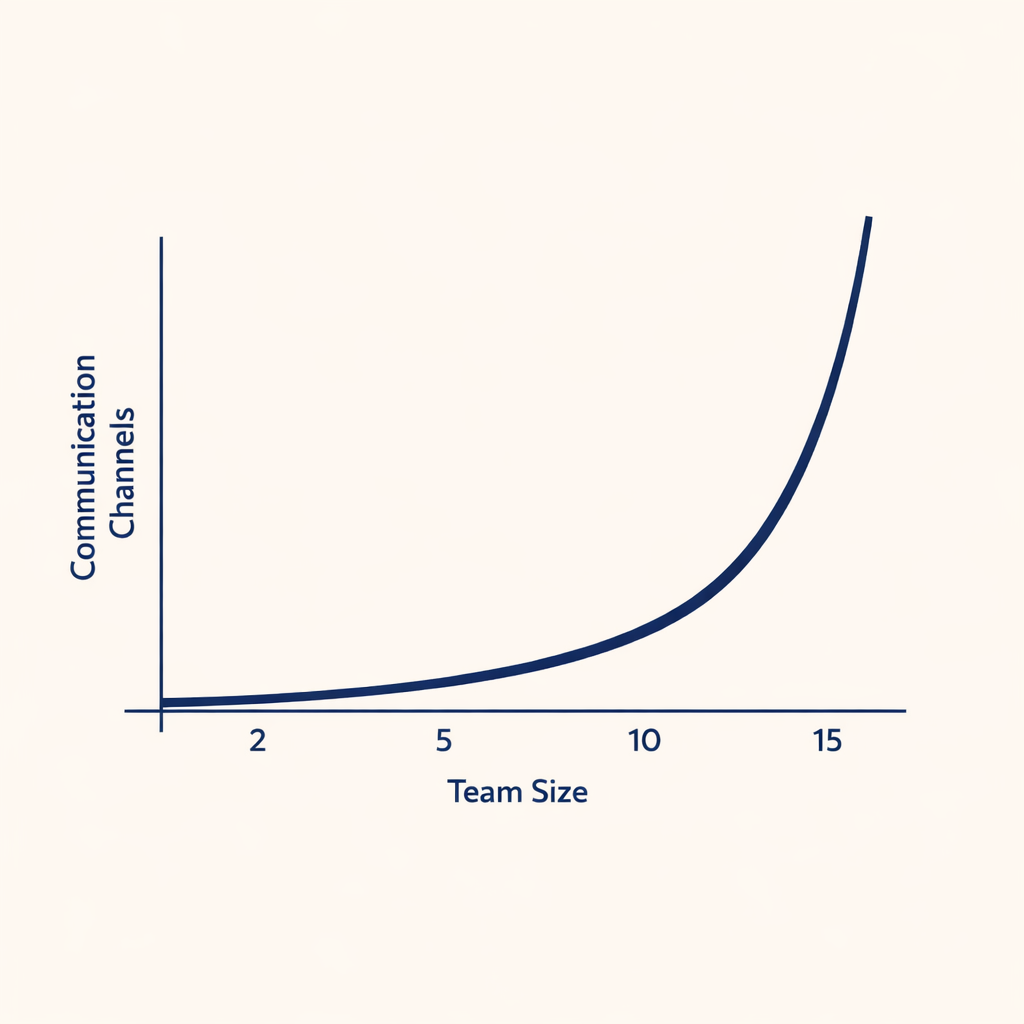
Fred Brooks, in his 1975 book The Mythical Man-Month, observed that adding people to a late software project makes it later, because every new person increases the number of pairwise communication channels by roughly n(n–1)/2. Seven people means 21 channels. Ten means 45. Fifteen means 105. The coordination tax is quadratic, and it surfaces as “mysterious” slowdowns at exactly the team sizes where the math stops being manageable.
W. L. Gore & Associates, the Gore-Tex company, built Dunbar’s number directly into its real-estate strategy. Founder Bill Gore had a rule: every time a building exceeded 150 employees, they built another building. He was running Dunbar’s ceiling inside his facility planning decades before Dunbar had published the paper.
The Ringelmann effect, documented in 1913 and one of the oldest findings in social psychology, is the same story in a different register: as group size grows, the effort each individual contributes goes down. People pull harder on a rope when there are fewer of them holding it. Max Ringelmann measured it with actual rope-pulling experiments, and the finding has been replicated many times since in workplace and sports settings.
The two-pizza team — Bezos’s practical statement of the cognitive sub-layer.
The role change: the first-line manager span is a cognitive limit, not a cost line
A first-line manager’s direct-report span is not a matter of preference for most cognitive work. It sits around 5 to 7. Push it to 10 and managers stop coaching and start triaging. Push it to 15 and the role has reverted to being an individual contributor with a different title. Organizations that scale cleanly keep that first layer tight even when the spreadsheet says it is expensive — because the spreadsheet is not pricing the coordination tax that a wider span produces downstream.
Coordination overhead grows quadratically with team size.
The org change: 50 and 150 are hard boundaries
The sub-team that actually owns a piece of work should be closer to 5 than to 10. Not because small teams are faster in principle, but because the communication-overhead curve gets steep fast after 7. Bezos was right about this, and almost every high-performing team of any reasonable size runs its real work through an informal group of four or five — regardless of what the reporting structure says on the org chart.
When a function crosses 50 people, it needs an operational substructure. Tribes, chapters, pods, whatever the label — or the Dunbar sympathy layer breaks. When the people in a team stop knowing each other well enough that a death in someone’s family would visibly register with everyone, culture starts dying quietly. By the time anyone notices, six months have usually been lost.
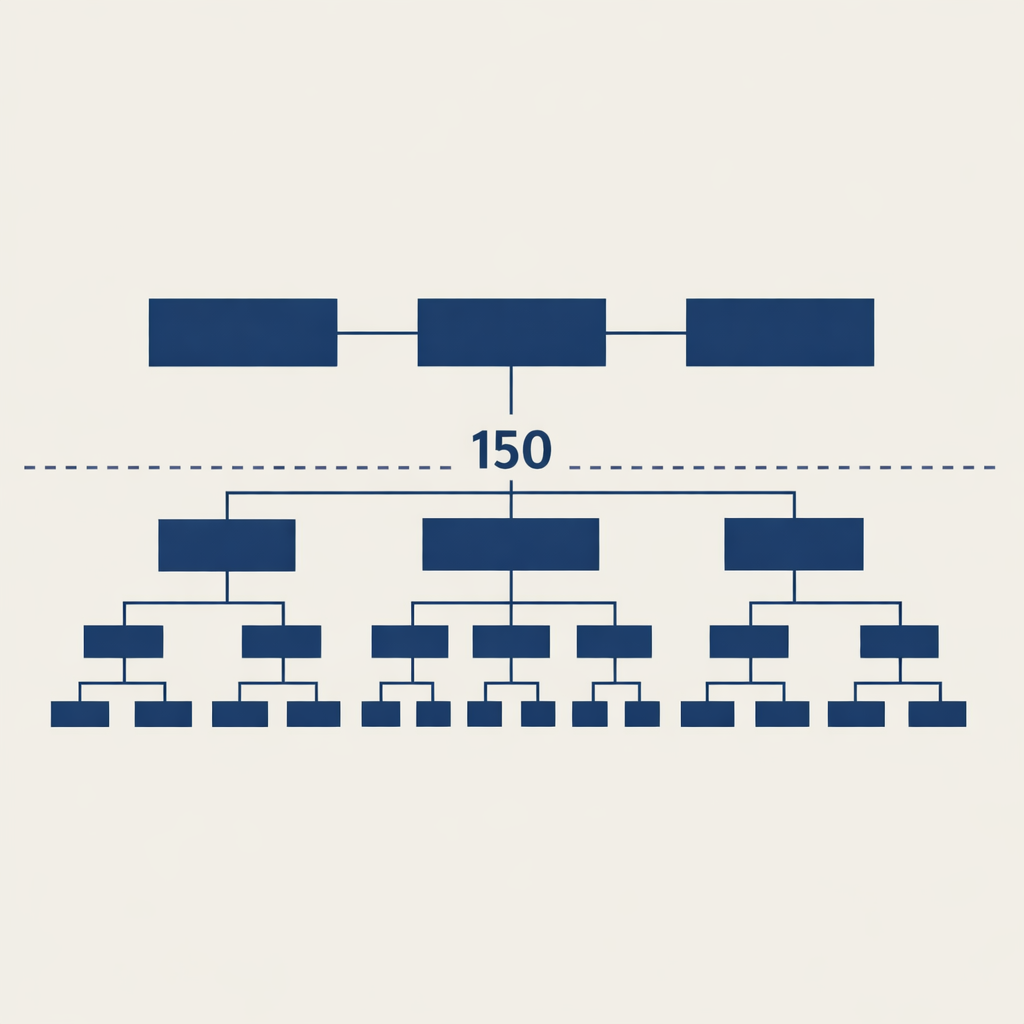
When an organization crosses 150, it runs two cultures whether the leadership admits it or not. The question is only whether the split is designed deliberately or happens by default. Organizations that handle the ceiling well accept it and build deliberate boundaries. Organizations that handle it poorly spend years pretending 400 people are “all one team.”
Cross 150 and you either build deliberate substructure or get default fragmentation.
The strategic consequence: org design is surrender, not construction
Good organizational design is mostly a process of surrender. The cognitive architecture of the humans running the teams picks team sizes for you, and the only real choice is whether to build the org chart around what actually works or to fight it and pay the tax. Every commercial organization that has tried to force a bigger number — a 12-person manager span, a 30-person “small team,” a 300-person “family culture” — has either quietly subdivided itself into groups that look suspiciously like the Dunbar numbers, or lost the thing that made it work.
AI augmentation does not move the cognitive ceiling. It moves the throughput below the ceiling. An IC managing four AI agents is still operating inside a span of four. A manager coordinating seven sub-teams of augmented ICs is still operating inside a Dunbar-5 layer. The numbers that governed organizational design before agents are the numbers that will govern it after.
Small intimate teams stay where the work actually gets done.
So what boards should do
Boards should design operating models around the Dunbar layers and treat AI-augmented throughput as a multiplier on what each cognitive unit can do — not as a license to stretch the unit past its ceiling. The specific actions sit at four layers: first-line spans at 5 to 7 even under headcount pressure; sub-team ownership at 5; operational substructure at 50; deliberate cultural boundaries at 150. These are not target numbers. They are discovered numbers. Every other structure is an argument with biology, and biology does not negotiate.
The Roman legions did not know about neocortex ratios. The Marines do not design their fireteams around anthropology papers. Jeff Bezos did not cite Dunbar when he ordered the pizzas. All three converged on the same numbers because the numbers are a property of the animal doing the work, not the work itself. The job of an organizational designer is to notice this — and then get out of the way.
References
Dunbar, R. I. M. (1992). “Neocortex size as a constraint on group size in primates.” Journal of Human Evolution.
Dunbar, R. I. M. (2010). How Many Friends Does One Person Need? Harvard University Press.
Miller, G. A. (1956). “The Magical Number Seven, Plus or Minus Two.” Psychological Review.
Brooks, F. P. (1975). The Mythical Man-Month: Essays on Software Engineering.
Hackman, J. R. (2002). Leading Teams: Setting the Stage for Great Performances. Harvard Business School Press.
Ringelmann, M. (1913). Early social-loafing experiments, Annales de l’Institut National Agronomique.
Gladwell, M. (2000). The Tipping Point. Popularised Gore’s rule of 150 for the management audience.
The Scrum Guide — current recommended team size: 3 to 9 members.
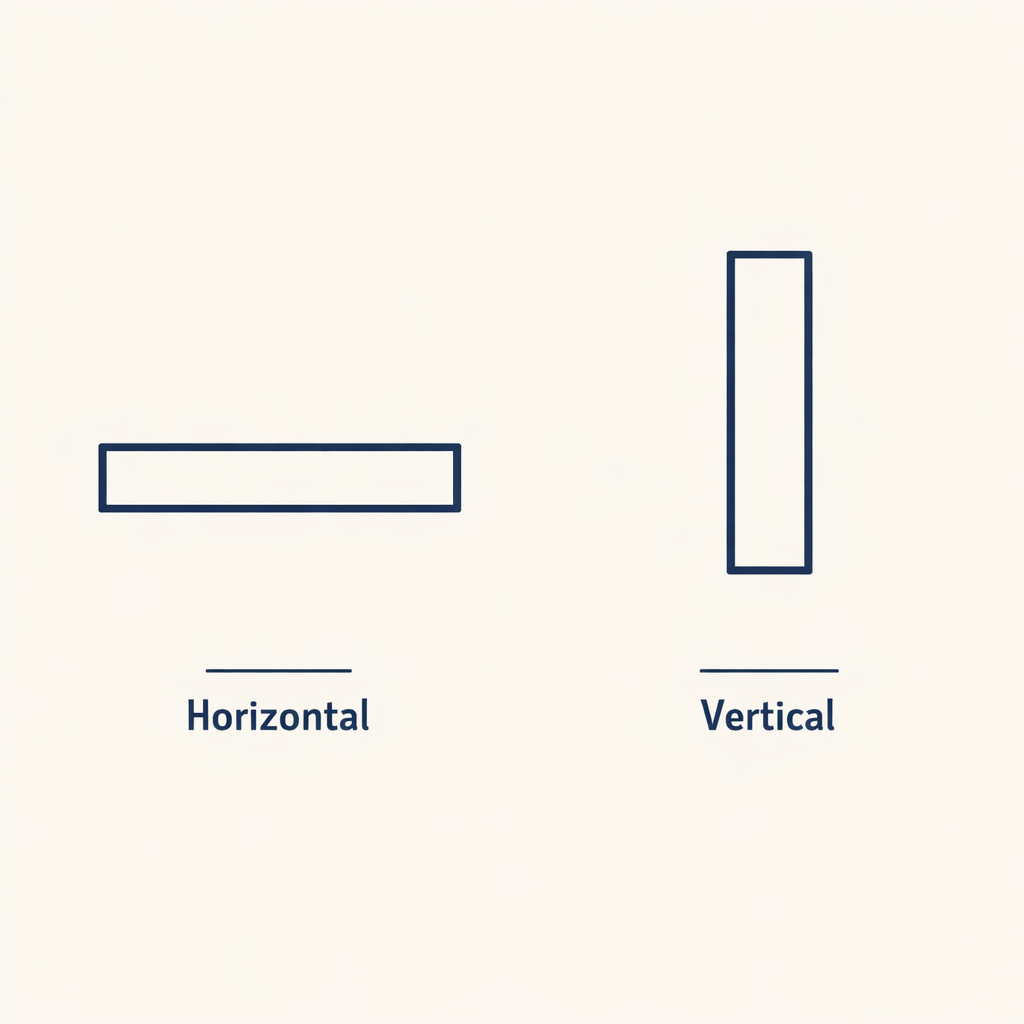
Horizontal is the substrate. Vertical is the value layer.
Gartner’s April read says eighty percent of enterprises will have adopted at least one vertical AI agent by year-end, and thirty percent of all enterprise AI deployments will be vertical-specific. Bessemer’s vertical AI report from this month is even more direct: vertical AI companies founded after 2019 are reaching eighty percent of traditional SaaS contract values while growing four hundred percent year-over-year. This is not a minor adjustment to the deployment landscape. It is a structural redirection of where the value of agentic AI accrues.
For boards in 2026, the implication is that the right framework for thinking about AI vendor strategy is no longer horizontal-versus-vertical. It is which verticals you bet on, and how early. Deployment speed defines advantage in this cycle, and the deployment race is now a vertical-by-vertical race.
The shift: vertical specialization beats horizontal generality at the workflow layer
Horizontal AI tools — the chat assistants, the general-purpose copilots, the broad productivity overlays — are still the largest category by usage. They are not the largest category by enterprise value. The reason is structural. A horizontal copilot is good at fifty things. A vertical agent is excellent at five things that are deeply embedded in a specific workflow.
When the enterprise needs to extract value, depth wins over breadth. Abridge in clinical documentation. Harvey and EvenUp in legal. Hebbia in financial research. Specialized clinical-coding agents at major payers. The vertical players ship integrations into existing systems, understand the regulatory and accuracy constraints of the domain, and deliver outcomes that horizontal tools cannot match without significant configuration effort that customers refuse to undertake.
The defensibility of vertical players is also higher than the market priced in 2024. The data flywheel inside a regulated vertical is genuinely hard to replicate. The customer relationships are stickier because switching costs include re-credentialing within the regulator’s expectations, not just re-implementing software.
Wide-shallow loses to narrow-deep at the workflow level.
The role change is the chief AI buyer becomes a portfolio manager
Inside enterprises, the executive responsible for AI vendor strategy is increasingly running a portfolio of vertical specialists alongside the foundation-model contracts. The horizontal tools form a substrate. The vertical agents form the high-value layer. The portfolio manager has to balance ROI realization against integration overhead, and has to decide which verticals to deepen versus which to defer.
The skill set for this role is closer to portfolio investment management than to traditional procurement or IT leadership. The portfolio manager has to read product roadmaps, anticipate vendor consolidation, manage concentration risk, and time entry into emerging verticals where category leaders have not yet emerged. None of this is in the standard procurement or CIO playbook.
Most large enterprises have not formally structured this role yet. The work is happening inside the CIO function or inside individual line-of-business AI initiatives, with no portfolio-level coordination. The result is double-procurement of overlapping vertical capability and missed early-mover advantage in verticals where the category leader will not stay reasonably priced for long.
The strategic consequence reshapes acquisition strategy
For enterprises in regulated industries — banks, insurers, hospital systems, large law firms, accounting firms — the vertical-AI thesis has a direct M&A implication. The category leaders in each vertical are trading at premium multiples now and will trade at higher multiples by 2027 once their data flywheels and customer concentrations are visible in audited financials. The window for acquisition at reasonable multiples is open in 2026 for most verticals. It will close.
For incumbents who do not acquire, the implication is partnership at scale. The vertical specialists need distribution that incumbents already have. The incumbents need capability that the specialists already have. The deal terms will tilt toward the specialists as their growth rates remain visible. Incumbents that delay partnership decisions to 2027 will pay more for less favorable terms.
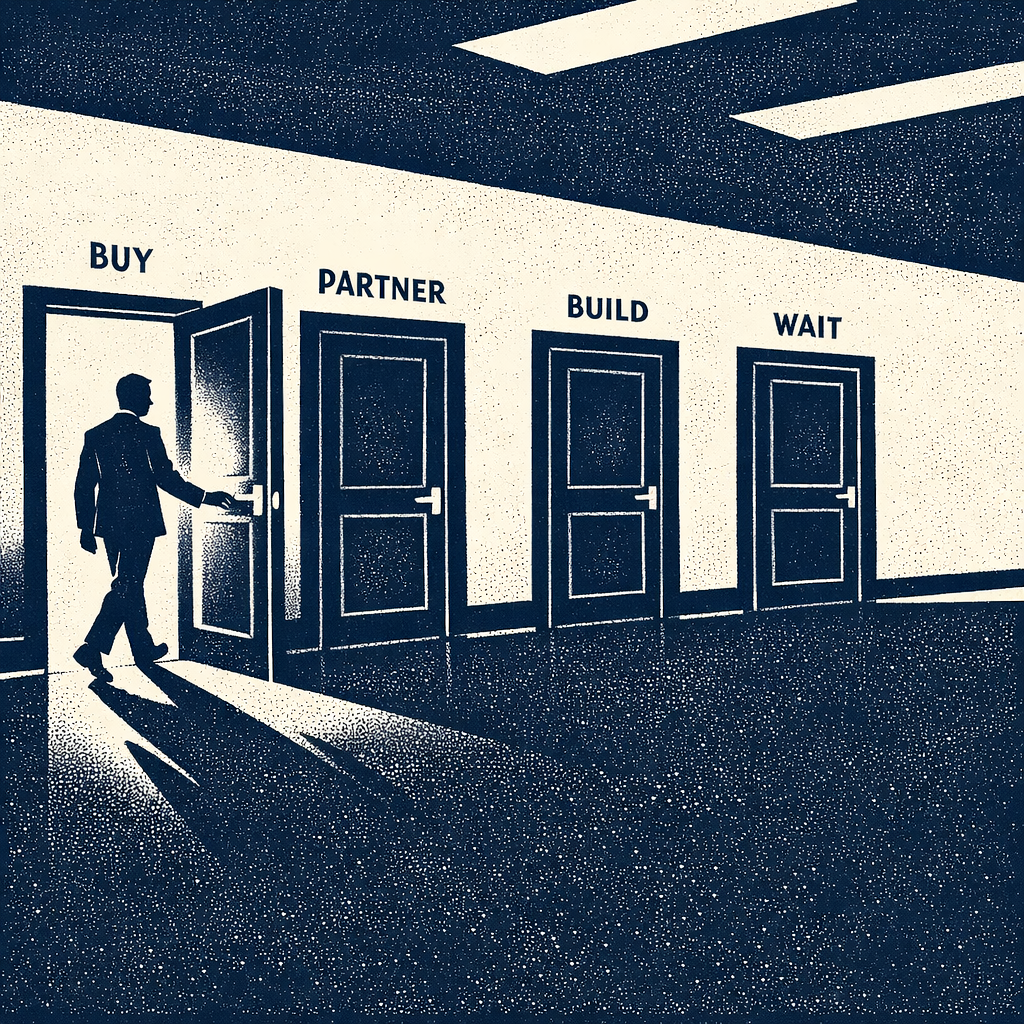
For boards governing AI strategy, the directive question is whether the company is buying or building or partnering for vertical AI capability — and whether that decision is being made deliberately for each vertical, or by default by the absence of a decision. Default-by-absence is the mode most large enterprises are operating in. It is the most expensive mode.
Per vertical: buy, partner, build, or wait — pick deliberately.
So what boards should do this quarter
Map the AI vendor portfolio with horizontal versus vertical breakdown. If the breakdown is more than two-thirds horizontal, the company is missing the value-creating layer. If it is unmapped, that is a more urgent finding.
Designate an executive owner for vertical AI portfolio strategy with explicit authority across line-of-business silos. The decisions are too consequential to be made silo by silo. The horizontal-tool decisions can stay with the CIO. The vertical-agent decisions need a portfolio view.
For each major vertical relevant to the business, assign a clear posture: acquire, partner, build, or wait. Defaulting to wait by not deciding is the same as deciding to wait — and in most verticals it is the wrong decision in 2026. Execution speed will separate leaders from followers in this cycle.
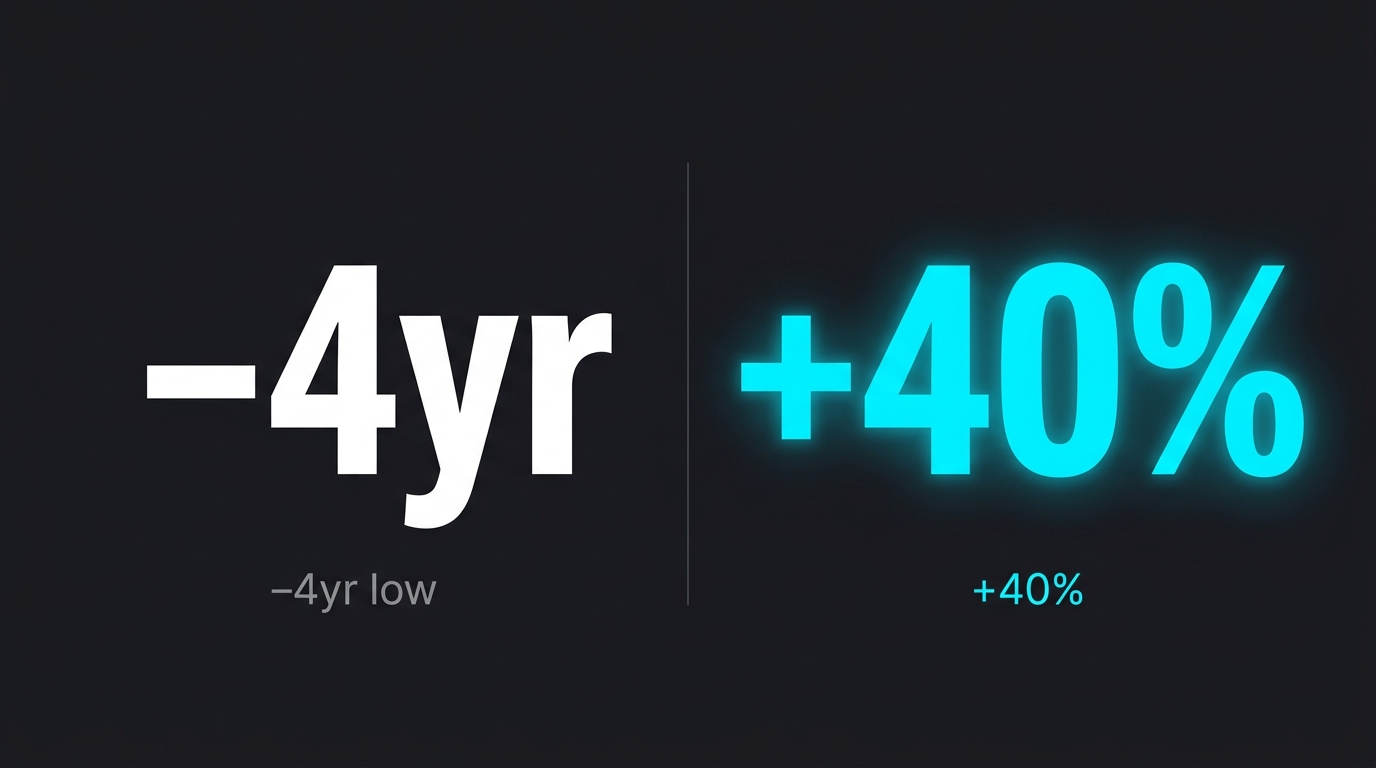
Challenger, Gray & Christmas reported in late March 2026 that U.S. employers announced 217,362 job cuts in Q1 — the lowest Q1 total since 2022. Within that aggregate, technology-sector cuts ran at 52,050, up 40% versus Q1 2025. In March specifically, AI was cited as the rationale for 15,341 cuts — 25% of the month’s total — making it the leading single reason for U.S. layoffs for the first time on the Challenger record. Major contributors to the technology figure: Dell’s annual filing-disclosed restructuring, Oracle’s March layoffs, and Meta’s Reality Labs reduction.
What it means
The aggregate-down, tech-up, AI-leading combination is not three separate stories. It is one story told from three angles. The aggregate number is down because the broad U.S. economy is operating with reasonable employment; sector-by-sector cuts in legacy industries are running below historical norms. The technology number is up because the sector is going through a structural reallocation — capital is shifting from headcount-led growth to compute-led growth, and the cost base of large software companies is being explicitly redesigned around that shift. AI is the leading cited reason because it is the strategic narrative that justifies the redesign to investors, customers, and remaining employees.
The implication for the rest of 2026: technology-sector hiring patterns will continue to diverge from the broader economy. Companies will hire aggressively for ML, infrastructure, agent operations, and applied research while shrinking headcount in functions that AI is augmenting or displacing. Net headcount may decline, but the per-employee compute and capability budget rises sharply. That changes what “growth” looks like in the financial reporting of the sector.
Andreas’s view
My read on this: the Q1 numbers are not a downturn signal — they are a transformation signal masquerading as cost discipline. Tech companies are not in distress. They are restructuring around the assumption that a smaller, AI-augmented workforce produces equal or greater output at a different cost basis. Some of those bets will be right; some will be the Block experience at smaller scale, where the rehire follows the cut by six to twelve weeks. The Q2 and Q3 numbers will tell us how clean the underlying productivity gain actually is.
I don’t think the AI-as-cited-reason metric stabilizes here. It rises through 2026. Once the framing carries an investor-relations multiple — which Block demonstrated — the disclosure pattern shifts in its direction across the sector. By year-end, AI-cited cuts will likely cross 30% of monthly U.S. totals, and that will look more like a permanent baseline than a peak.
The way I see it: the Challenger headlines document neither a labor crisis nor a productivity victory. They are capturing a sector-wide capital reallocation with a coherent strategic logic and uneven execution quality. The more interesting question to me is which side of that reallocation any given business is on — and whether its cost base reflects the structure it has today or the structure it intends to have in 18 months.
Three things I’m watching
Three things I’m watching as this plays out:
I’ll be watching whether companies are tracking the technology-sector comparison for their own organization: revenue, headcount, and per-employee compute spend versus the closest five public-market peers. That gap is where structural exposure shows up first.
I’ll be watching whether organizations hold a meaningful distinction in their communications between AI-driven productivity reductions — workflow-modeled, with measurable output — and broader restructuring justified by other factors. The market may not differentiate; but the ones with rigorous operations will.
I’ll be watching Q3 unit economics against any Q1 workforce action. The reduction is on the books in Q1; whether the underlying productivity thesis holds shows up in Q3 output measures, not headcount.
Related signal: Block’s 4,000-person cut in late February established the public investor-reaction benchmark for AI-narrated reductions; the Q1 pattern reflects companies responding to that signal.
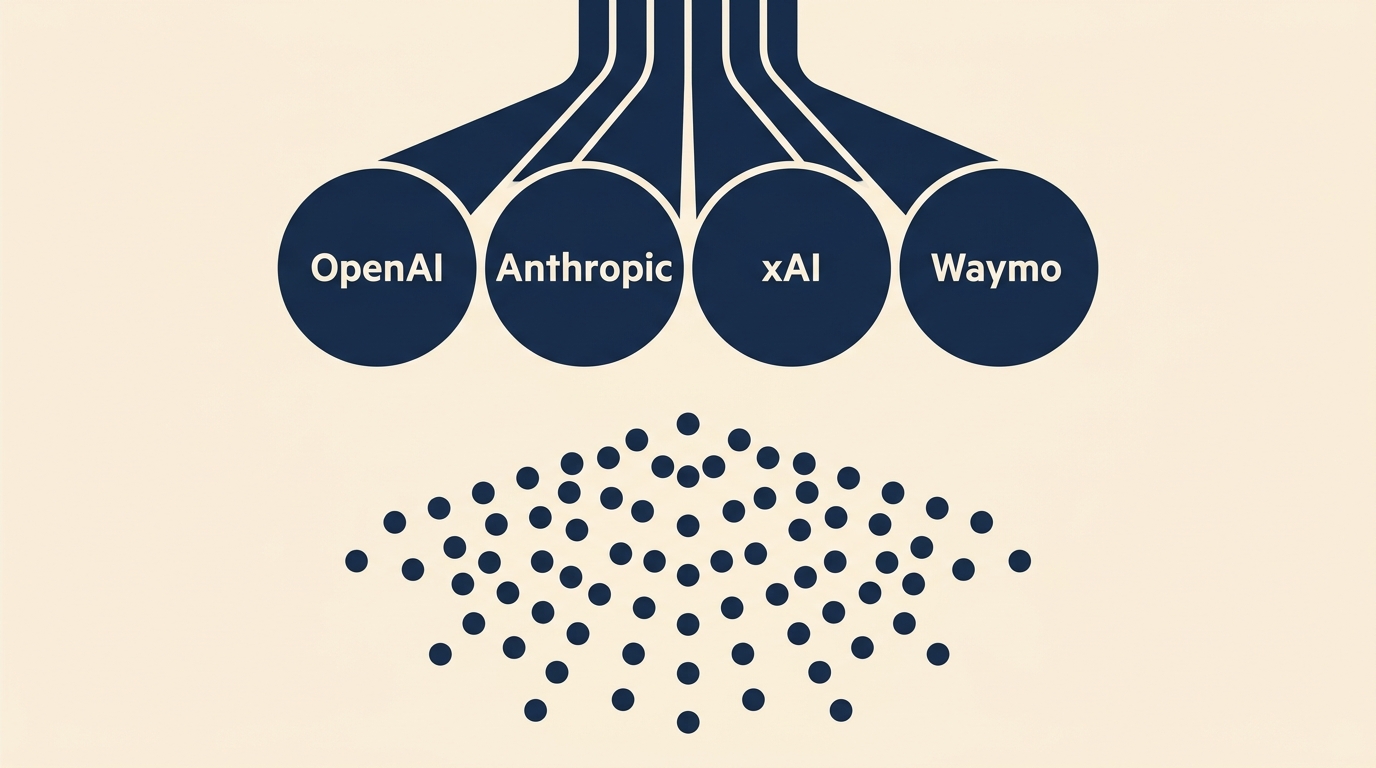
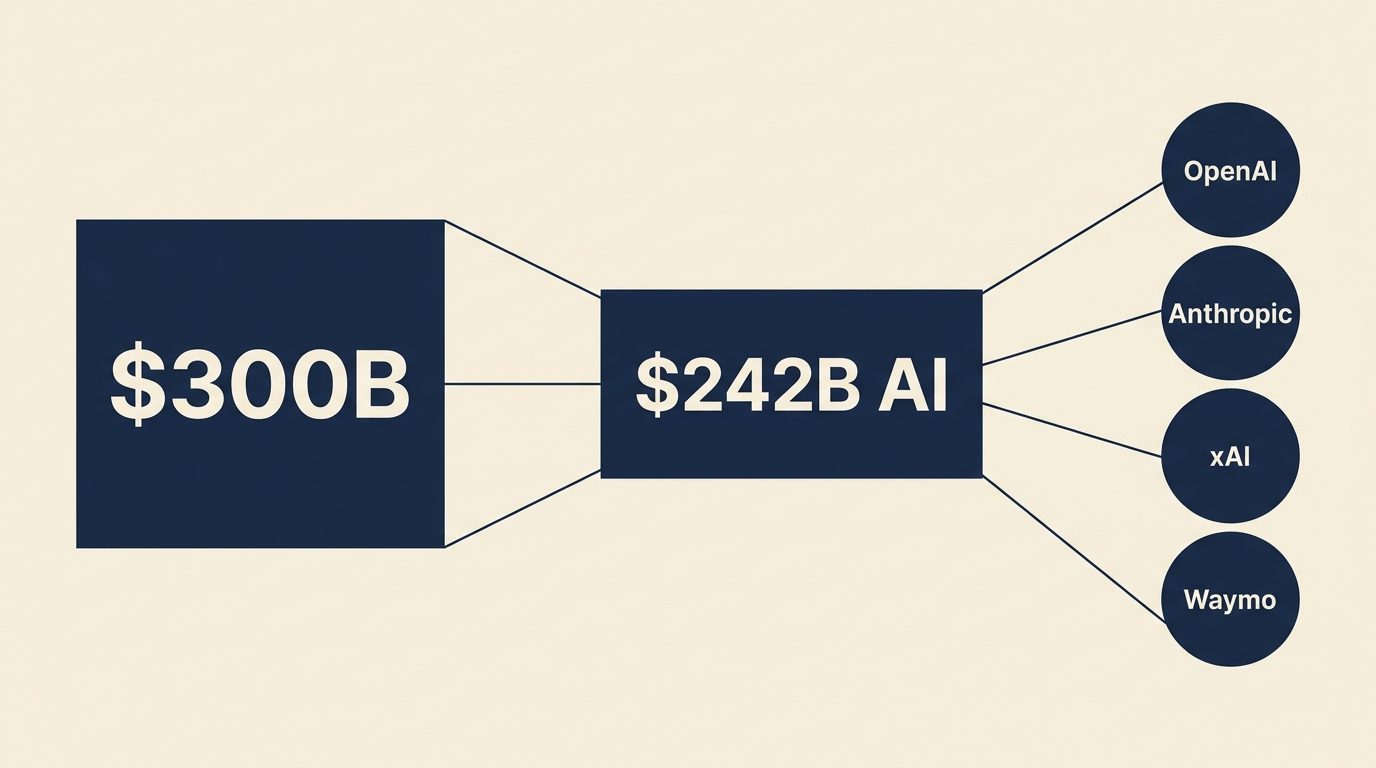
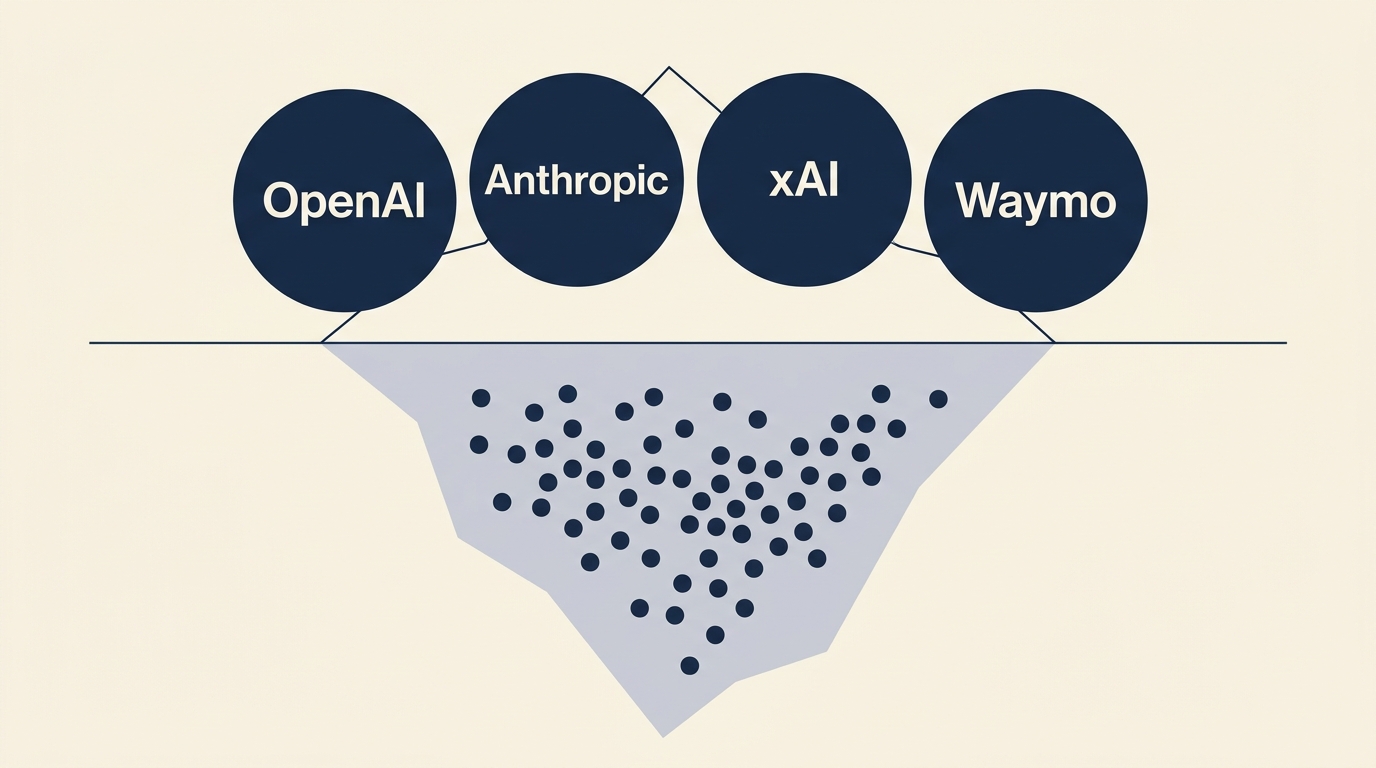
In Q1 2026, 47 startups crossed the billion-dollar valuation threshold for the first time — the largest single-quarter cohort in over three years. The pace is concentrated at the seed and early-stage end. Global venture funding hit roughly $300 billion in the quarter, of which 80% — about $242 billion — flowed to AI companies. Four companies (OpenAI, Anthropic, xAI, Waymo) absorbed 65% of all capital deployed.
Q1 2026 venture funding — concentration at the top.
What it means
Two things become visible at the same time. First, the market is willing to underwrite billion-dollar valuations earlier in the company lifecycle than at any point since the late-2020 boom. The valuation framework is no longer derived from realized revenue. It is derived from deployed compute and team density. Second, capital concentration at the top has reached a level where four companies define the cost of capital for everyone else. A new AI startup raising in 2026 is competing for the same dollars that just priced OpenAI at $122 billion.
The early-stage explosion and the late-stage concentration are two symptoms of the same conviction: capital has decided that AI is a winner-take-most market, and it is funding accordingly.
Andreas’s Take
My read on this: the unicorn count is a lagging indicator of a much earlier decision. That decision was made — quietly, by capital allocators — when the consensus shifted to a single conviction: AI capability gaps will widen, not narrow, over the next decade. From that conviction two strategies follow logically: fund the few names that might dominate the frontier (concentration), and over-fund the early stage so that whatever the next breakthrough looks like, you own a piece of it (proliferation). The 47 new unicorns are the proliferation half.
I don’t think this is a bubble in the conventional sense. A bubble is a price disconnect from fundamentals. What we’re seeing is a price connection to a forecast about fundamentals. If the forecast is right — capability gaps widen, AI returns accrue disproportionately to a few players — today’s valuations are conservative. If it’s wrong, half of these unicorns will not survive their next priced round.
What I’d say to boards and CFOs reading these numbers: don’t take comfort from “the market is hot.” Take instruction. Capital is signaling where it expects the next moat to form. The companies absorbing the capital are absorbing optionality, not just dollars.
Above the waterline: $188B. Below: optionality.
Recommendation
Three things for leaders watching this market:
Treat unicorn-count reports as competitive intelligence, not social proof. Look at which unicorns and what they are building — that is the signal of where the market expects gaps to open.
Reassess your own compute and talent allocation against the new benchmark. If AI startups can attract billion-dollar valuations on team and compute alone, your incumbent organization is competing for the same talent at a different cost basis.
Stress-test your strategic plan against a scenario where capability concentration plays out. What does your business look like if three or four frontier labs control the compute infrastructure and all serious AI deployment runs through them?
Two announcements in the week of March 2–8, 2026 redrew the agent landscape. Anthropic’s Model Context Protocol crossed 97 million installs, with every major AI provider now shipping MCP-compatible tooling — moving the protocol from experiment to default infrastructure for tool-calling agents. Apple confirmed that the redesigned, AI-powered Siri targeted for release alongside iOS 26.4 will be powered by Google’s Gemini model running on Apple’s Private Cloud Compute. In parallel, Anthropic rolled out memory features to all Claude users and deployed Opus 4.6 as an add-in inside Microsoft PowerPoint and Excel.
What it means
The MCP install count makes the connectivity layer between agents and tools a solved problem at the standards level. That is a meaningful shift. For two years, the friction in shipping agents was that every tool integration was bespoke; the integration debt scaled linearly with the number of tools and the number of agents. With MCP at default-infrastructure scale, the integration cost is closer to fixed than linear, and the bottleneck moves from connectivity to orchestration and governance.
Apple’s decision to rent cognition from Google for Siri is the more strategically loaded story. It signals that even the most vertically integrated consumer-tech company in the world has concluded that building competitive frontier-model capability inside the company is not the right capital allocation. The Private Cloud Compute envelope handles the data-sovereignty argument. The Gemini choice handles the capability argument. The combination is an explicit acknowledgment that frontier-model capability has consolidated at a tier of providers most companies will rent from, not build alongside.
Andreas’s view
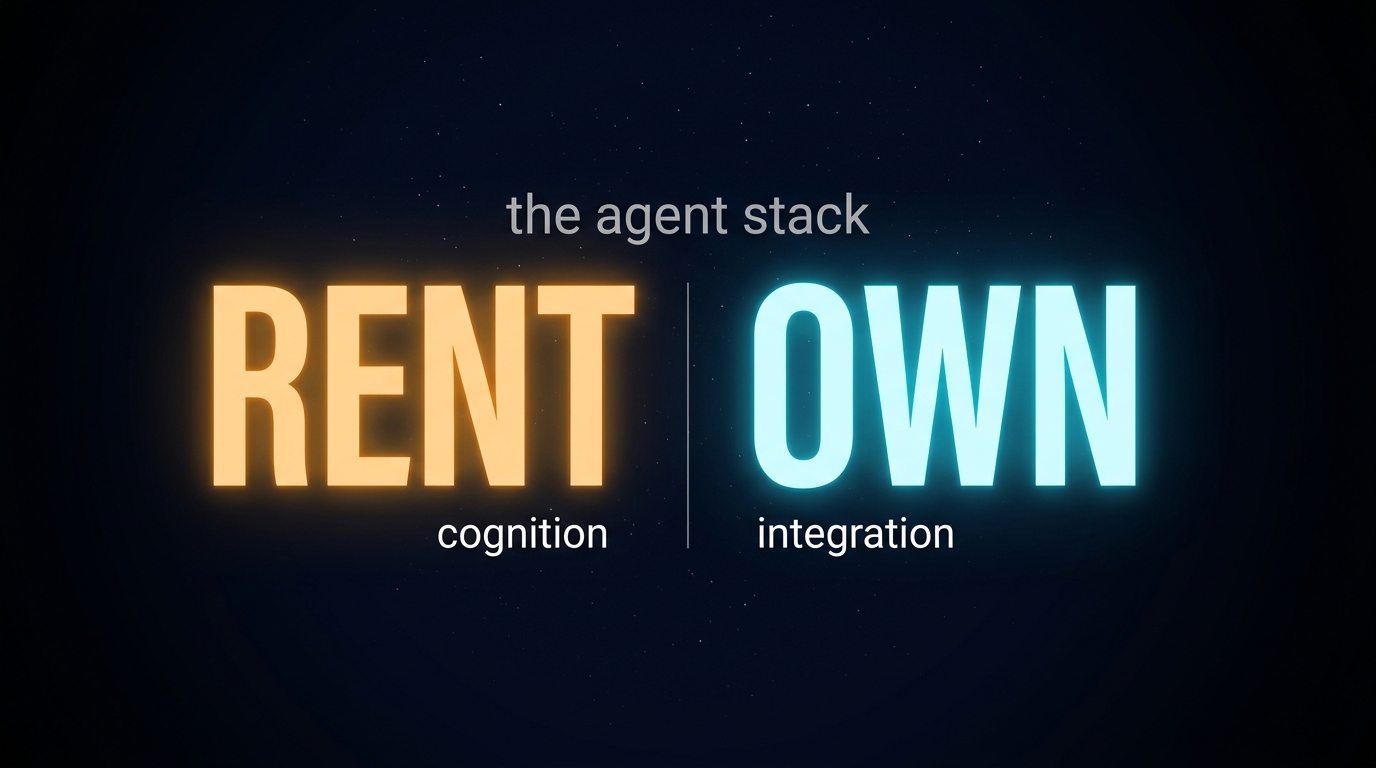
My read on this: the agent stack is settling into a recognizable shape. Standards layer (MCP, becoming generic). Frontier-model layer (a small number of providers — OpenAI, Anthropic, Google, with regional players underneath). Application layer (where most enterprise value is created). The interesting strategic action for the next 24 months is in the application layer, where the questions are which workflows to embed, which data to expose, and which orchestration logic to own.
I don’t think Apple’s choice is anomalous. It is the start of a wave. Companies that have been building internal frontier-model capabilities will increasingly find that the math does not work — the capex is consumer-internet scale, the talent is concentrated at three or four employers, and the capability gap to “good enough internal model” widens every six months. The economically rational answer for almost everyone is: rent the cognition, own the integration and the data envelope around it. Apple has now made that a defensible board-level position.
The way I see it: the most important architectural question right now is whether the cognition layer (rented, frontier-model, expensive but improving exponentially) is clearly distinguished from the integration layer (owned, workflow-specific, where the moat actually lives). Where those layers are blurred, I’d expect companies to find themselves overpaying on one side and under-investing on the other. The Apple-Google deal is the clean reference architecture for how that separation can look.
Three things I’m watching
Three things I’m watching as this plays out:
I’ll be watching whether companies architect the cognition layer and the integration layer separately — treating frontier-model providers as utilities while building proprietary infrastructure around workflow integration and the data envelope.
The companies that preserve optionality will be the ones that default to MCP-compatible tooling for new agent integrations. The standards layer is no longer a strategic differentiator — the question is how quickly organizations stop treating it as one.
I’ll be watching how internal frontier-model build efforts hold up against the Apple-Gemini reference case. Where differentiation rests on owning the model, I’m interested to see whether those bets come with a credible 36-month capex and capability projection — and what happens when they don’t.
Related signal: Anthropic’s Opus 4.6 PowerPoint and Excel integrations move frontier-model capability deeper into the enterprise default tooling, accelerating the rented-cognition pattern.
Related signal: NVIDIA GTC 2026 (March) emphasized agentic frameworks and Fortune 500 production deployments — the application layer is where the next wave of enterprise AI value is being created.
Related signal: 95% of generative AI pilots still fail to reach production. The connectivity layer being solved does not solve the operating-model layer.
Related signal: Apple choosing Gemini over OpenAI for Siri changes the competitive math for every enterprise still scoping a frontier-model partnership.
Through the week of February 16–22, 2026, the AI-cited layoff story moved from edge case to mainstream framing. AI was cited as the rationale for 4,680 February job cuts in the U.S. — roughly 10% of the month’s total. Baker McKenzie announced 600–1,000 layoffs (up to 10% of global headcount) framed as a pivot to AI-augmented service delivery. Dow disclosed 4,500 cuts in January with explicit AI-strategy framing. A Harvard Business Review piece in the same window argued that companies are laying off based on AI’s potential, not its measured performance. An Oxford Economics report from January concluded that many AI-cited layoffs were the consequence of past overhiring, not present AI productivity.
What it means
Two things are happening at once. First, AI productivity is real for specific workflows and starting to show up in unit-cost reductions. Second, “AI” is becoming the public-facing rationale for cost actions that boards and CEOs have wanted to take for other reasons — overhiring during 2021–2022, deteriorating margins in slower-growth segments, restructuring to a target operating model that was already in motion. The two stories overlap, and the public communication does not distinguish between them.
For employees, the framing matters because “we are restructuring” and “AI is replacing your role” carry different signals about whether the function comes back. For investors, it matters because the market is pricing AI-cited cost reductions as durable while restructuring-cited cost reductions are typically priced as one-off. CEOs who choose the AI framing get a multiple uplift. That incentive structure tells you why the framing is becoming dominant.
Andreas’s view
My read on this: the next 12 months will see a steady drift toward AI-as-explanation in layoff communications, regardless of whether AI is the underlying driver. The reason is not deception — it is signaling. CEOs need a forward-looking story that the cost base will stay reduced, and “AI productivity” is a cleaner story than “we hired too aggressively in 2022.” The public record will eventually reconcile this; quarterly earnings will reveal which companies actually shipped the productivity gain and which simply downsized.
I don’t think the workforce numbers are yet the right metric to watch. The right metric is the ratio of revenue per employee in the months after the cut. If revenue per employee climbs durably, the AI framing was substantively correct. If it plateaus or reverses while operational quality declines, the framing was a positioning move and the company will be hiring back inside 18 months — at higher cost and lower morale.
The way I see it: when a CEO presents an AI-cited workforce action, the productivity model behind it should be specific enough to name which workflows, which output measures, which time horizon, and which control group. Where those answers are vague, the action is restructuring with AI vocabulary. That is not necessarily wrong, but the distinction matters — and I think it matters most at the board level, where the conversation should reflect what is actually driving the decision.
Three things I’m watching
Three things I’m watching as this plays out:
I’ll be watching whether companies maintain a clear internal distinction between AI-driven productivity actions (with a workflow-level model behind them) and AI-framed restructuring actions (justified by other reasons). Both can be valid; conflating them confuses execution, and the ones that keep the distinction clean are more likely to deliver what they promised.
The companies that track revenue per employee monthly for the 12 months following any AI-cited workforce reduction will have the clearest view of whether the productivity gain actually materialized — and I’ll be looking at that number as the most honest signal in the public record.
I’ll be watching how specific companies get in their external communication around AI-related workforce changes. Vague “AI is making us more productive” framing tends to erode credibility internally faster than a precise statement of which work has been automated and which has been redesigned — and over the next year, that credibility gap will start showing up in retention and hiring data.
Related signal: Block’s 4,000-job cut a few days later (Feb 26) made the AI-as-narrative pattern explicit at scale and tested the market reaction.
Manage Consent
To provide the best experiences, we use technologies like cookies to store and/or access device information. Consenting to these technologies will allow us to process data such as browsing behavior or unique IDs on this site. Not consenting or withdrawing consent, may adversely affect certain features and functions.
Functional
Always active
The technical storage or access is strictly necessary for the legitimate purpose of enabling the use of a specific service explicitly requested by the subscriber or user, or for the sole purpose of carrying out the transmission of a communication over an electronic communications network.
Preferences
The technical storage or access is necessary for the legitimate purpose of storing preferences that are not requested by the subscriber or user.
Statistics
The technical storage or access that is used exclusively for statistical purposes.The technical storage or access that is used exclusively for anonymous statistical purposes. Without a subpoena, voluntary compliance on the part of your Internet Service Provider, or additional records from a third party, information stored or retrieved for this purpose alone cannot usually be used to identify you.
Marketing
The technical storage or access is required to create user profiles to send advertising, or to track the user on a website or across several websites for similar marketing purposes.